Economists have long viewed GDP per capita to be the best measure for the economy: the material wealth of the average person within a country’s borders. GDP per capita is untainted by human biases in its calculation. It’s result comes directly from all transactions in the clear-market economy, without arbitrary weights added to any industry or the statistical issues caused by surveys.
GDP per capita is weighted by the price system. It’s weighted because some products are more valuable than others. An Apple iPhone has lower sales numbers than actual apple fruit, but the iPhone is a higher value product so we need to add a weight so it’s value added to the economy is not understated.
The market price is the meeting point between the marginal seller’s minimum selling price and the marginal buyer’s maximum buying price. This is the price which maximizes welfare for all buyers and sellers in the market. Therefore the price is the perfect weight to determine the marginal value-added to GDP.
GDP is modeled as:
GDP = Consumption + Investment + Government + Exports - Imports
Consumption, Government and Exports, are the domestic transactions of consumers, government entities, and foreigners buying from domestic producers. Imports are subtracted as they are not produced domestically.
Investment are products purchased by firms such as factory equipment or computer software. Investment does not include stocks and bonds. The stocks and bonds allow businesses to invest in equipment if they please, otherwise it’s money unspent. Only if the cash from stock sales are used on new factory equipment, that money will be reported under Investment.
Consumption, Exports, and Investment are voluntary market activity. Government is not. Government receives income through involuntary taxation. But for GDP to include all domestic spending, Government must remain included.
GDP is also equal to the sum of all incomes within domestic borders. If I spend $1 on an apple, the store owner will receive $1 in income from me. All money spent is someone else’s income, so GDP can be calculated by adding all incomes.
GDP will naturally be larger for larger countries. To find GDP per capita, take the GDP and divide it by the domestic population. Dividing by population shows the number of transactions per person. Using GDP per capita we can get an estimate for the quality of life for the individuals living in those countries. So while China has one of the largest GDPs, their GDP per capita is pretty low, occurring around the #75 mark.
GDP per Capita Issues
-
GDP weighs private and government spending equally. Private spending creates value in voluntary market transactions, government “value” is derived from involuntary tax. Government takes my pay without my consent, then purchases a bomb and kills others without their consent. Taking economic resources and blowing them up is not economic growth, so it should be excluded from GDP. In its current form, GDP calculates all market transactions without anyone deciding what should or shouldn’t be counted as economic gain, so to drop violent government action from GDP would introduce arbitrary human bias.
-
GDP only tracks goods which are reported to statistical agencies. Black market goods are not reported in GDP, or any measure. For developing countries, black markets can take up a large majority of transactions in the economy, making their GDP inaccurate.
-
Higher GDP per capita doesn’t guarantee higher happiness levels. If we have two countries, A and B which have identical GDP, but in country A everyone beats their kids, then country A’s residents will be sadder even though their material wealth is the same as country B’s. Nonmarket interactions such as child-beating will affect people’s happiness even if it doesn’t show up in any macroeconomic measure.
Generally you see people moving from developing countries to developed ones, not the other way around. People are getting something out of the higher wealth levels of countries with higher GDP per capita. From this you can claim there is a correlation between GDP per capita and happiness or job satisfaction or whatever, but because these terms are hard to measure statistically, it is difficult to back this claim.
Inflation
In a fiat monetary system, price level is determined by the number of bank notes relative to the number of real goods. If the central bank prints more currency, prices will rise. Central banks are incentivized to print currency because prices will not rise until after the new money is introduced: they are spending new money at old prices. Free money for them.
To measure GDP per capita growth over time, you must account for inflation. GDP adjusted for inflation is real GDP. Real GDP sets a base year and adjusts for inflation for all comparison years relative to the base year. To compare GDP between 1990 and 2020, find the inflation rate between the two periods and divide the 2020 GDP by the inflation rate to get real 2020 GDP with base 1990.
$$\frac{\text{Nominal 2020 GDP}}{\text{Inflation rate between 2020 and 1990}} = \text{Real 2020 GDP}_{1990}$$
Inflation Adjustment and Purchasing Power Parity
The default inflation value is the “GDP deflator,” the average inflation for all goods measured by GDP.
Different goods face different levels of inflation. GDP deflator is an average of all goods within domestic borders, including goods bought by government entities and firms. When it comes to assessing what the average consumer buys, a survey-based measure such as CPI (Consumer Price Index) will provide a better rate of inflation. CPI is a US-based survey index which creates a “bundle of goods” the average consumer is said to buy. Inflation calculations using CPI can better reflect price increases an average person will feel.
CPI introduces statistical problems due to consumers switching goods, or the good itself changing, between survey periods.
To do cross-country real GDP per capita comparisons, there is another survey-based macroeconomic measure called PPP (Purchasing Power Parity). PPP’s purpose is to equalize purchasing power of different currencies in different regions. Labor tends to be cheaper in Bangladesh than in the US, so $1 can buy you more services in Bangladesh than in the US1. PPP adjusts for these differences by controlling for how many things you can buy with $1 for both countries.
Inflation Measurement Issues
The goal of real GDP is to find the change in satisfaction due to monetary changes. Economists are trying to measure change in GDP from use of available resources rather than the number of dollars printed.
Say the CPI survey finds the fruit economy consists of 10 apples and 5 bananas purchases. If apples cost $1 and Bananas $2, then initial GDP is 10 × 1 + 5 × 2 = 20. If an apple tree falls and the number of apples relative to bananas changes, then the price of apples will rise relative to bananas. If an apple is $5 to the banana’s $1, then bananas are the better buy. New GDP could be 1 × 5 + 8 × 2 = 21. The increase in GDP happened because a drop in supply of apples caused the price to rise.
If in the same year, central bank doubled the money supply, then new GDP is actually 1 × 10 + 8 × 4 = 42. How can economists distinguish the GDP change from resources vs inflation?
People’s hidden substitution rate between goods makes it impossible to distinguish supply & demand from inflation. As more substitutions occur over change of supply or demand, inflation adjustment will systematically overestimate inflation because it’s measuring real price increases as inflation. People have substituted away from the tracked goods.
New goods entering and old goods leaving cause us additional problems. If customers are buying the new good, it will cause error in our calculation because there is nothing to compare it to in the past. We face the opposite problem for old goods.
Goods can change in nature over time. Smartphone prices have been increasing for the last couple of years, so we could say that the good is facing inflation. But the quality of the good is also increasing, so the extra cost is influenced by higher demand. Price indices assume that the good is equivalent from time period to time period, so if the good changes we face error.
PPP comparisons across countries may sometimes be impossible. Ethiopians eat teff while Indonesians eat rice. PPP will fail to properly compare the most important grain in both countries, as the price of rice is not relevant to Ethiopians and the price of teff is not relevant to Indonesians.
High School History
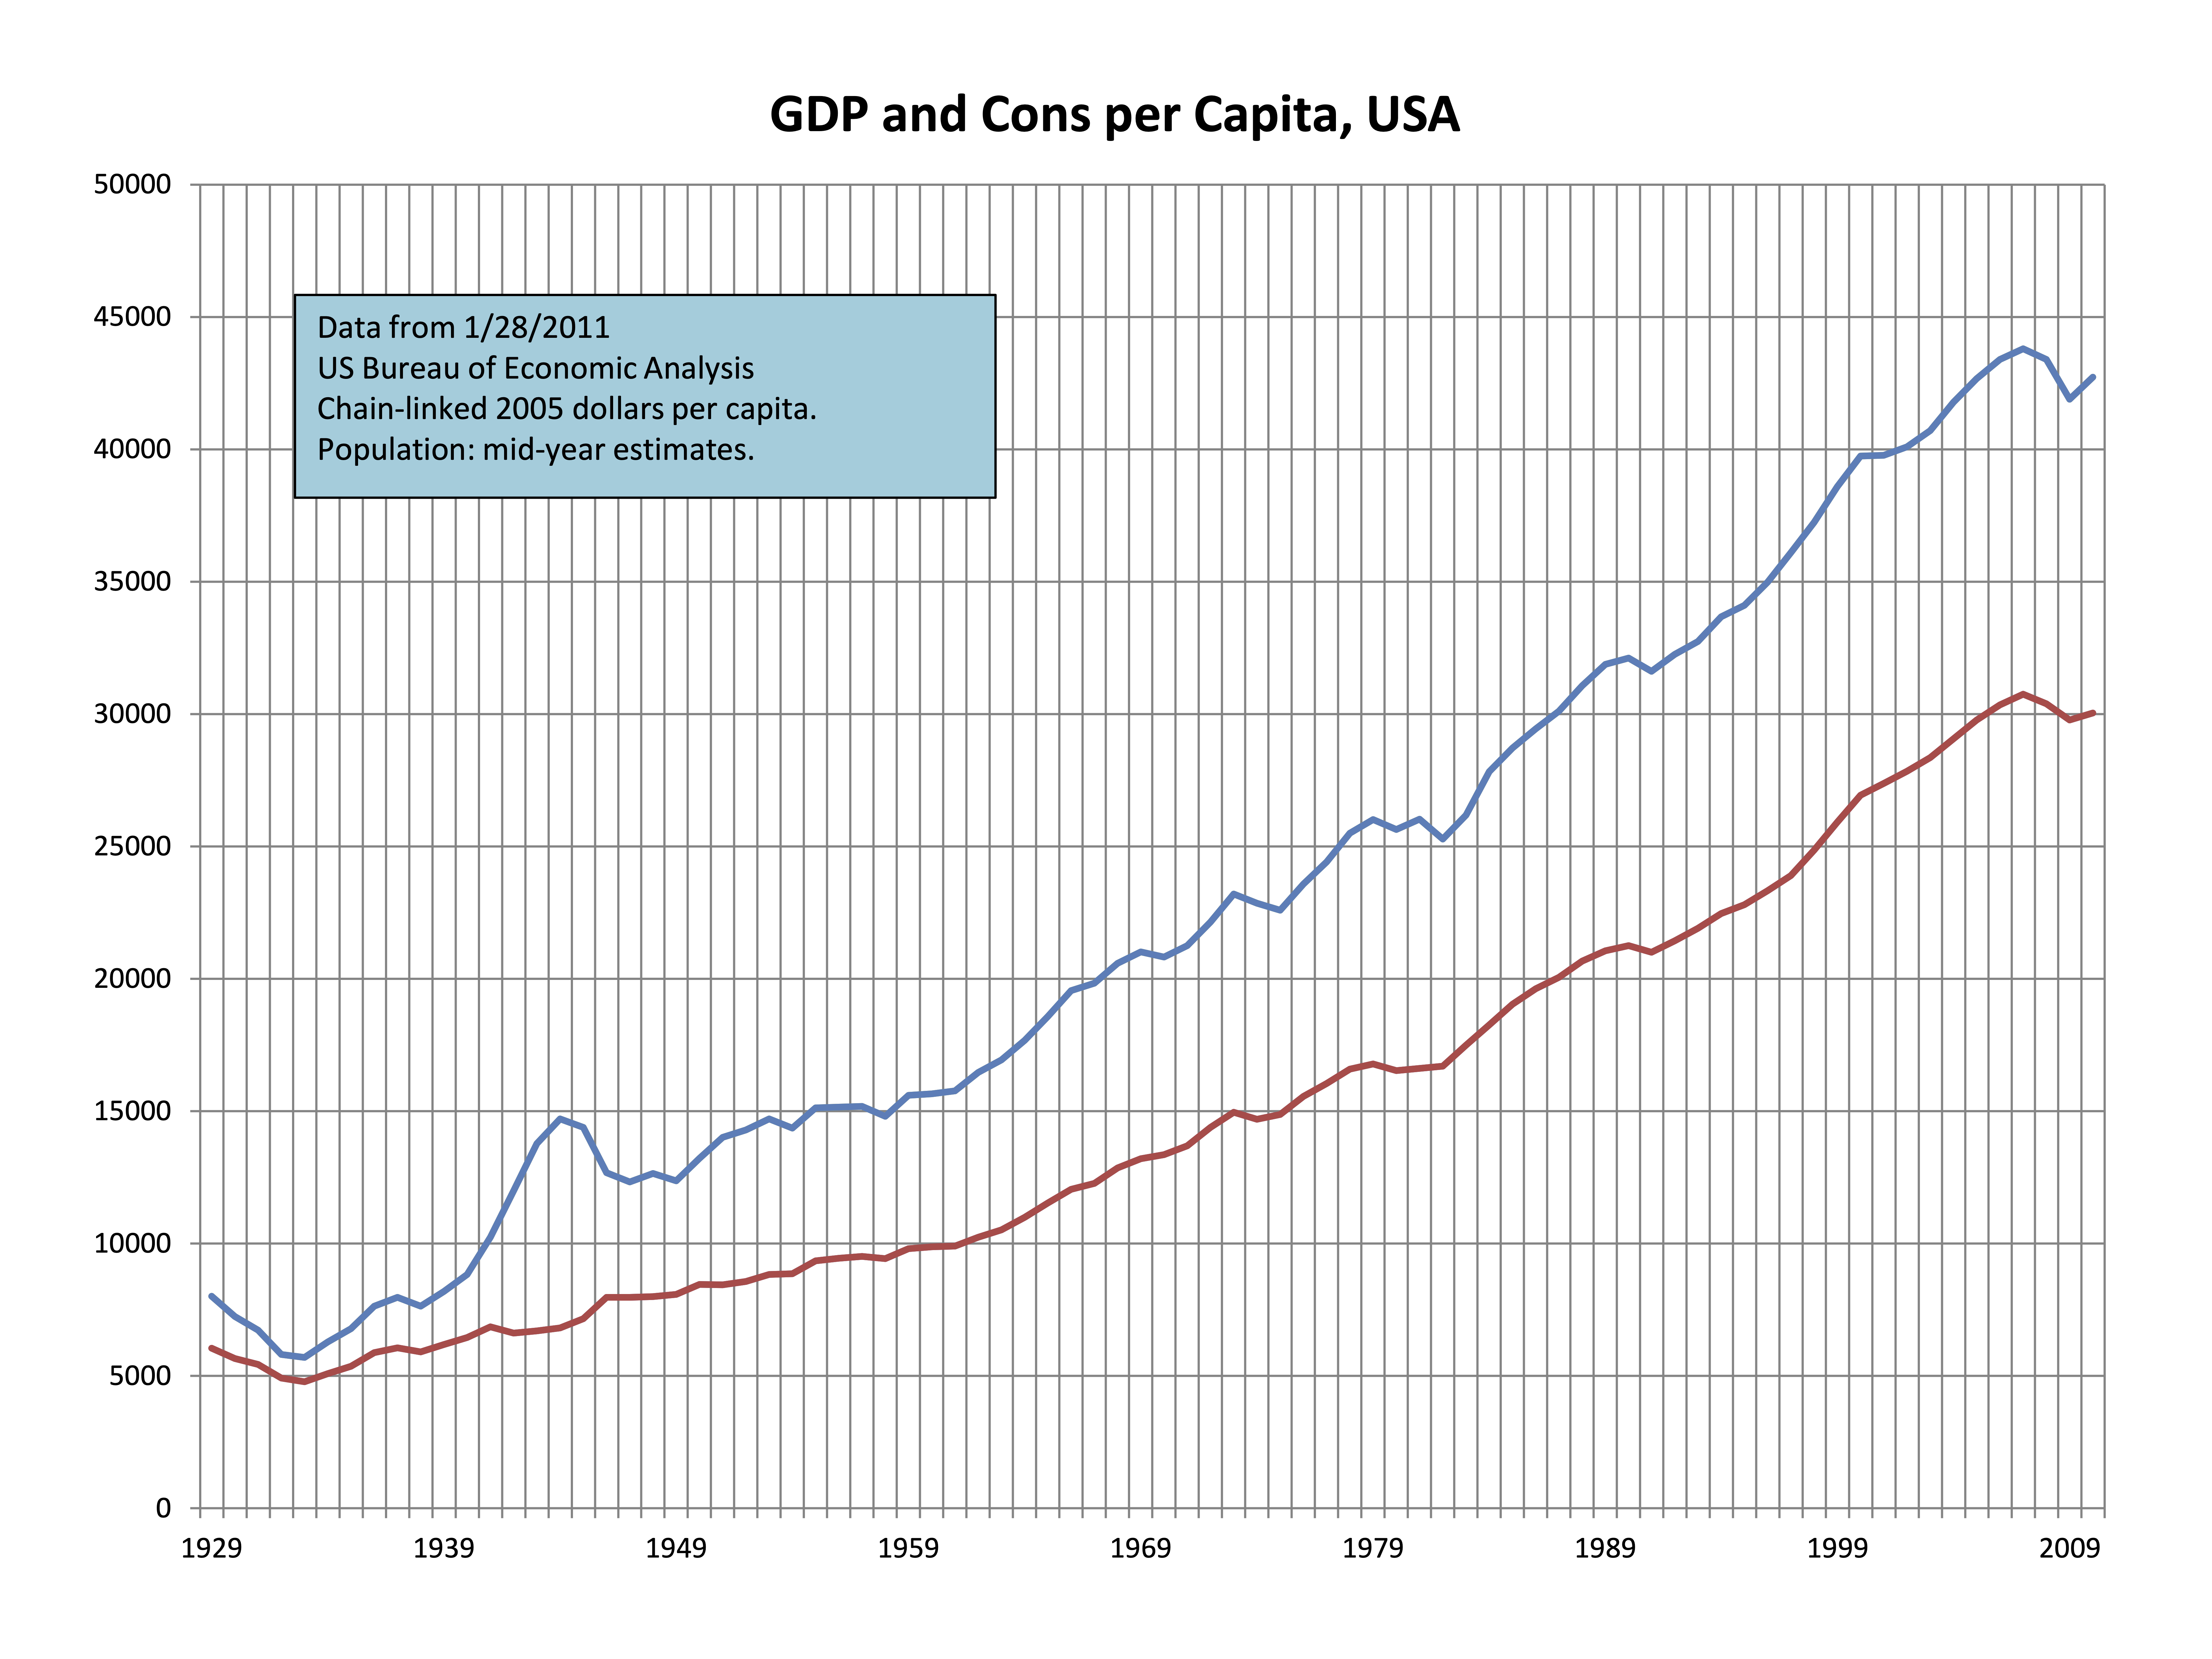
Did World War II end the Great Depression? That’s the standard high school curriculum, and it makes no economic sense.
GDP per capita is a measure of economic productivity, standard of living. How limited resources are used to to satisfy unlimited desires. This can be achieved two ways: utilize existing resources better, or find new resources.
War achieves neither. The production of bombs and weapons are used not to increase standard of living. Destruction of lives and property is the opposite of what GDP per capita aims to measure.
GDP per capita rose during WWII because of Government spending. Government absorbing a majority of the economy’s resources only to blow them up is not conducive to standard of living. In this case, instead of GDP per capita, I would recommend using Consumption to find the true end to the Great Depression: When WWII ended.
The worst measure: Human Development Index
A popular but highly flawed macroeconomic measure is HDI (Human Development Index). HDI is GNI2 per capita, PPP adjusted. HDI adds weights for life expectancy at birth and average years of education.
The problem with this is that GNI/GDP per capita already correlates very highly with life expectancy and education rates, so HDI is correcting for nothing. It is only adding additional arbitrariness to what was an objective measure.
GDP per capita tells you productivity according to the preferences of consumers living in the country being analyzed. Consumers of a country may not put a high value on education, instead opting to spend those years doing whatever else. Say in Germany, people go to apprenticeships and begin working earlier, while in France, everyone gets a PhD. Are people in Germany really worse off than those in France? If people in Germany dislike formal education, then they will find HDI disagreeing with them on their career choices, regardless of their actual career outcome.
With GDP, supply and demand determine the value of products sold, and no good gets extra value because some “experts” were not happy with the final market values. With HDI, the experts have decided to speak for the crowd as to what their values should be.
Oddities with the Top GDP per Capita Countries List
If you go on Wikipedia and look at the list of countries by GDP per capita, inflation adjusted using PPP, you’ll notice unexpected countries to take up the top ranks. You would expect countries like the US to be in the top ten but instead it’s mostly tiny countries.
- Very small countries like Luxembourg (population 700,000) and Monaco (40,000) are city-states. Most of the population that works in these cities actually lives in the surrounding countries. Therefore the city will produce high GDP per capita because the people producing are not counted in the GDP per capita population.
- More diverse economies such as Germany or France have rural farms and industrial regions which tend to have lower productivity than urban regions. These rural regions will bring down GDP per capita for their respective countries. City-states such as Luxembourg or Monaco get their rural supplies from other countries: their rural supply lines lie outside country borders. Excluding these rural regions increases their GDP per capita.
- Tax havens such as Switzerland or Bermuda will also have inflated GDPs. Companies will set up their headquarters there, and move huge amounts of income through those countries, but these “headquarters” will have few employees. This increases GDP per capita.
- Some countries have large oil industries. Oil is geographically concentrated but has heavy demand worldwide, so oil countries will have high
Exports. Smaller countries with oil reserves have high GDP relative to their population. The US has good oil production but it’s still a small part of GDP here due to our large population of 340 million. Canada has a medium sized population (41 million), which means their GDP gets more of an oil-boost than the US does. Countries with small populations and near 100% GDP from oil tend to have very high GDP per capita boosts. These include UAE (11 million), Qatar (3 million), and Brunei (half million). Norway has a population of 5.3 million, but half of their GDP is from oil, which pushes them up the GDP per capita list.
The US has an unusually high GDP for its population size and diverse economy. The US has the third largest population in the world, and it’s GDP per capita is amongst city-states which have a tiny fraction of the US’s population. Given the characteristics of the US relative to its peers, it’s safe to say that the US is, by far, the most economically successful country in the world.
Sources
This article is mostly sourced from scattered notes from my economics studies. Here are some additional links.
Gross domestic product Wikipedia Article
List of countries by GDP (PPP) per capita Wikipedia Article
Human Development Index Wikipedia Article
Updated 2026-04-13: This article was originally written in 2022. I rewrote it in 2026
-
In theory international prices should slowly work towards an equilibrium due to arbitrage. However tariffs, quotas, and other trade restrictions can create large transaction costs which prevent prices from ever equalizing. In this case restrictions on immigration force developing country wages to remain low. Workers have a difficult time leaving for higher pay countries, keeping the labor supply in the developing country artificially high. Besides trade restrictions, other transaction costs such as the cost of shipping will keep goods in different regions at different prices. Saffron will always be cheaper in Iran than in the US simply because the plant is native to the region and must be shipped to the US. ↩︎
-
GNI is similar to GDP: it tracks a country’s citizens for a country’s income instead of all economic activity within a country’s borders ↩︎