I’ve called this private meeting today because there is an imposter among us.
There is an imposter among us.
This brother right here has been out making beats on the side, yes he has.
Pretending he’s broke walking amongst us.
This brother has been eating every day, can you believe that? Eating every day.
Pretending he’s with us, he’s not one of us.
I did not want to believe this, but I walked into the brother Kanye’s closet and I found new shoes.
I found new shoes!
Kanye, would you like to step forward and explain these new shoes?!
– Leader of Kanye’s Fraternity, Broke Phi Broke
The original goal of the poverty threshold was to track the number of people in poverty in the US. To do this properly, an arbitrary line must be set, then there must be a way to track real changes to the line over time, which means raising the line with inflation but not economic growth. Unfortunately, because the line uses the CPI price index to track growth, it no longer serves as a useful measure.
A price index is a normalized average of prices relative to a specific base year. It is used to measure the general changes in large groups of products over time. The most “general” price index is the GDP deflator. It covers the difference of price levels of all final goods in the economy relative to a specific base year, hence the name, gross domestic product. But unfortunately GDP isn’t a great measure for the price changes that the average consumer faces. The GDP covers many goods that consumers don’t buy, such as goods bought by the government or by firms. To address this, there is the CPI (Consumer Price Index), which measures only the changes in prices of a specific bundle of goods which are determined by an urban survey every 10 years.
CPI does not perfectly solve the problem of the GDP deflator. CPI is an average, and like most socioeconomic averages, for every individual it is at least somewhat wrong. Think about it like this: If the average age in the US is 38, how many people are actually 38? The more accurate the statistics, the less representative it gets. If the average is 37.8327746, there is a decent chance that nobody is that age at this particular moment.
Everyone’s purchases are different, so no one is perfectly measured by CPI. To say that you know an individual’s purchases by looking at the CPI is to commit a fallacy of division.
That being said, it is now becoming clear that the CPI is a poor way to measure the progression of poverty. The poor are not a random sample of the population; they are a very biased sample. If the price of iPhones, Yeezys, and Starbucks Fraps all go up, it will be reflected in CPI even though the poor do not consume those goods. The original poverty threshold was based on a basket of “necessities,” but instead of tracking the price of that basket, CPI is used. This systematically overestimates where the true poverty line would be.
This is all compounded by the fact that the current methods of inflation calculation (a Laspeyres index or a variation) systematically overestimate inflation, since it can’t account for people switching to good B when the price of good A rises. The Laspeyres method continues to track good A even if people have stopped buying it.
There are clear public choice issues here. The poverty threshold was originally created in the 1964 alongside the Great Society (President Johnson’s New Deal clone) as a way to measure the need for federal welfare programs. So there is a clear benefit of overstating poverty to those government employees who administer welfare programs and those citizens who receive it. This way they can justify the program’s continued existence and expansion.
What is telling is that the poverty threshold was originally adjusted by a basket of necessities, but was switched to CPI later in 1969. You can see the effects here: 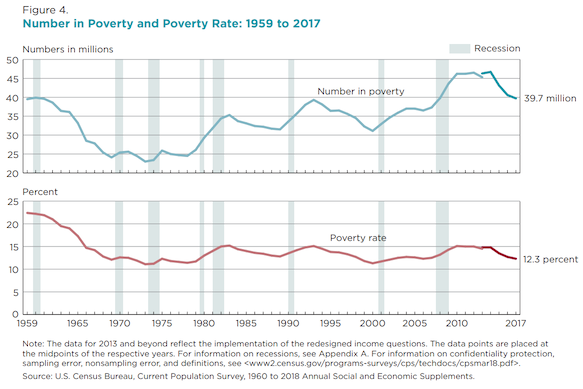
From 1964 to 1969 the number of Americans “in poverty” decreased dramatically, by economic growth, since the poverty threshold doesn’t count welfare benefits as income. From 1969 to the present under the new adjustment rule, the number of people under the line has remained stable. The threshold no longer simply corrects for inflation, it corrects for economic growth as a whole, and making it seem that poverty is stagnant despite clear growth of the economy. The poverty line is essentially being constantly redefined, so tracking any changes is impossible.
If the line were defined poorly in the first place then I wouldn’t be surprised if it were just stupidity behind the decision to use CPI. But the fact that it was consciously changed to this standard, and the fact that this standard is so heavily used in the justification for the expansion of these programs, makes me suspect that foul play was involved.
It is a good exercise to try and figure out how a better measure could be constructed. The basket of “necessities” isn’t actually too bad, but we will still face some systematic bias from the substitution effect. A professor of mine suggests this: instead of tracking specific goods, we may track the lowest priced items within a broad category of goods. So for food, you could look at the federal guidelines for calorie and nutrient consumption, then every year make a basket of items that represents the cheapest way to fulfill that standard during that year. So a basket will include a lot of efficient foods like dry beans and vegetables like cabbage and onions, which provide good nutrient intake at a low cost. But some items may change year to year, for example one year we may have turkey necks (low cost protein) and in another year we may have whole chickens. So instead of trying to accurately measure what poor people are actually buying, we can avoid the substitution effect entirely by making a plan that a cost-conscious consumer may exhibit.
This plan also completely avoids the issues presented by Paasche and Laspeyres price index calculation methods. As stated before, the Laspeyres method overstates inflation because it doesn’t account for changes due to substitutions. The Paasche method has the opposite problem where it doesn’t track the period before the substitutions occurred, causing an understatement.
New goods entering and old goods leaving cause us additional problems. If customers are buying the new good, it will cause error in our calculation because there is nothing to compare it to in the past. We face the opposite problem for old goods.
Goods that change heavily over time are in between: see the price of smartphones. Smartphone prices have been increasing for the last couple of years, so we could say that the good is facing inflation. But the quality of the good is clearly increasing also, so the extra cost is undoubtedly being influenced from more demand. Price indices assume that the good is equivalent from time period to time period, so if the good changes we face error.
All of these problems are present with GDP deflator and CPI because they are trying to accurately measure what people are actually buying. But here we are trying to measure how much a person would have to spend in order to reach a minimum standard of living. Anyone with an income level above the minimum can reach the standard, whether they actually do so is a different issue. Anyone below the line couldn’t make ends meet even if they tried. New goods can be added and old ones can be removed without issue, since the goal is not to track the prices of all individual goods. Absolute poverty is defined to a standard of living, and not the prices of specific goods. This methodology cuts out the issue of the substitution effect completely, allowing accurate poverty tracking even through periods of high economic growth.
Sources: consultation from professors, Wikipedia articles on price indices, US poverty, and the Greenbook. Skit #4 by Kanye West
Updated 2020-06-05 (added postscript and embedded image)
PS: There is a possibility that the list of low cost goods being released to the public could increase the price of those goods. For example, if the government makes a list of the cheapest nutritional foods on the market, then this may stimulate demand for those foods and increase their price. This is easily remedied by keeping the list secret and releasing it a couple years later. The US Federal Reserve already does this with its Greenbook of economic forecasts: if the Federal Reserve released its forecast just after it is created, then the people in the economy will react to the forecast, which will change the outcome of the forecast (perhaps only in theory, the forecasts are often so poorly done I doubt it would make a difference). Instead the Federal Reserve releases the forecasts five years after the forecasted period ends.